Image budgets for email
Since images are the largest external resource, their optimization can lead to big performance gains. The average email in my typography study weighed 711 KB all in, with 79.8% of that weight comprised of images and 9.5% webfonts. With mobile email now hovering around 55%, a sensible image weight cap is more important than ever. But there’s confusion around what that number should be. Needing a more credible answer than my usual 'common sense' estimates, I wanted to explore how image weight translates into load time.
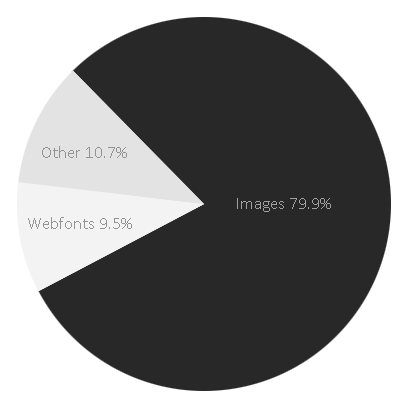 |
Images accounted for 79.8% of an average emails weight in my typography study vs. 9.5% webfonts
Image weight doubled
In 2011 I looked at fifty retail emails and found the average image weight to be 257 KB. Four years on my typography study found it to be more than double at 568 KB. The discrepancy of these so called type-based emails being heavier than retail seemed off, so I re-ran the retail numbers to see how the same fifty brands compare four years later.
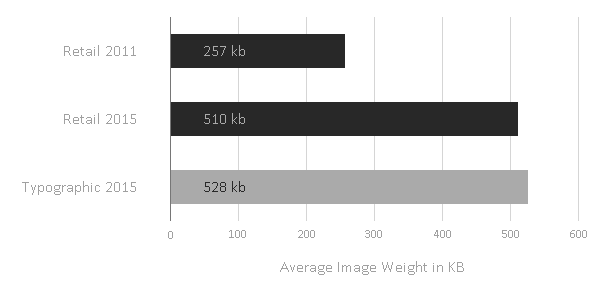 |
Avg. image weight from three studies, the same 50 retail brands doubled their weight over four years
The average image weight for those same fifty retail brands has increased 98% over four years, effectively doubling to come in at 510 KB vs. 257 KB. This brings it more inline with the typography study. I purposely left animated Gifs out of the two retail studies. To even things out I saved out the first frame from the three Gifs in the typography study, then re-calculated the numbers which reduced the average image weight from 568 KB down to 528 KB.
Shift to mobile
From 2011 to 2015 email design has gone through a big shift. In 2011 the majority of the retail emails in my sample group used desktop postcard layouts, today those same retailers break down as 32% scalable, 30% adaptive, 30% desktop and 8% responsive. Scalable layouts have driven the trend towards narrower widths, ~600px is now standard, but they tend to be much longer. Designers are possibly exploiting the idea that scroll rates are higher on tablets and mobile devices by adding more content. Product images also need to be rethought for mobile, this often translates to over-sized and stacked.
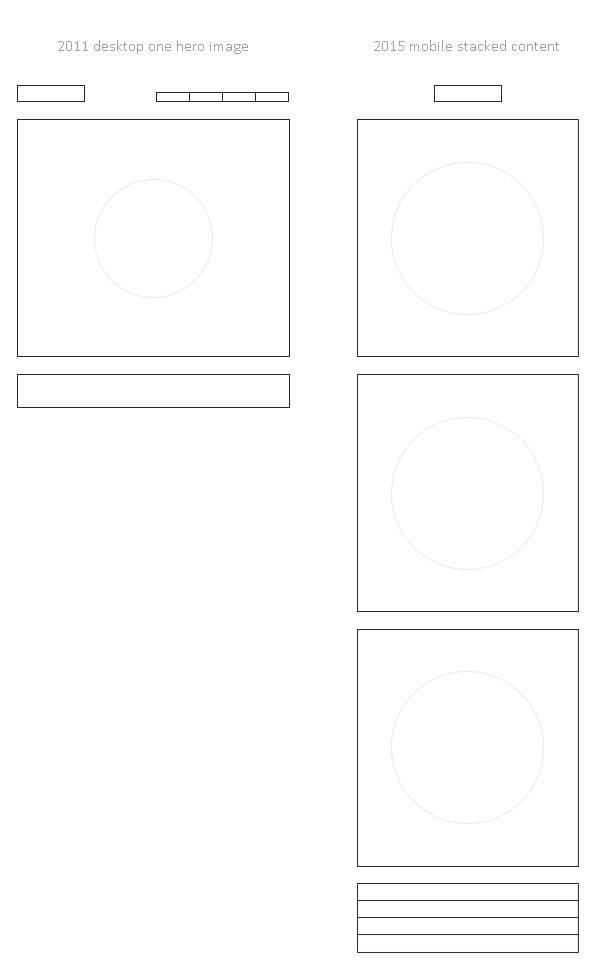 |
From 2011 to 2015 retailers have shifted from desktop postcard layouts to longer scalable & adaptive designs
Image handling in responsive emails can also be challenging, with image swapping, hiding and scaling being key concerns. The desire for retina images can further exacerbate the problem. Recent support for responsive images in iOS 9 might help us better navigate these issues in future. Here's a handful of retail emails from the group for comparison:
- Free people 2011 and 2015
- Horchow 2011 and 2015
- Lord & Taylor 2011 and 2015
- Neiman Marcus 2011 and 2015
- Kenneth Cole 2011 and 2015
Setting a performance budget
Given that my two studies saw average image weights of 510 KB (retail) and 528 KB (typographic), I wanted to get a feel for how long ~500 KB worth of images takes to download and how this stacks up against user expectations. When discussing performance I've found that it helps to frame goals in time-based metrics. Kilobytes can seem abstract to non-designers, but everyone understands what it means to wait 3 seconds for images to load. The question is how long can we reasonably expect users to wait?
While the 2 second page load benchmark is often quoted, a number of experts have been advocating 1 second. Scott Jehl of the filament group mentions, "The performance community tends to agree that 1 second is a reasonable goal for rendering a usable page on a fast connection, and we tend to shoot for rendering something useful in 2 seconds on slower devices on mobile networks as well."
The 1 second rule of thumb is explained by Jacob Nielsen's 3 responsive time limits:
- 0.1 second user feels that the system is reacting instantaneously.
- 1.0 second user flow of thought stays uninterrupted, even though they will notice the delay.
- 10 seconds user will want to perform other tasks while waiting for the computer to finish.
Essentially after more than 1 second our mind starts to wonder, as IIya Grigorik states, "To keep the user engaged, the task must complete within 1000 milliseconds. Ergo, our pages must render within 1000 milliseconds."
1 second in image weight
WebPageTest is a great online performance tool built by Patrick Meenan. You can select a connection speed, such as 'Mobile 3G – Fast (1.6 Mbps / 768 Kbps 150 ms RTT)'. This tells us that Mobile 3G Fast has 1.6 Megabits per second download speed, and 768 kilobits per second upload speed with a Round Trip Time of 150 milliseconds (1 second = 1000 milliseconds). 1 byte equals 8 bits, so in order to convert the download speed into bytes we'd divide by eight: 1600 kilobits per second / 8 = 200 kilobytes per second. So our 20 0 KB image should download in 1 second on a mobile 3G Fast connection.
| Connection | Download speed | Kilobytes per second |
|---|---|---|
| Cable | 5 megabits per second | 625 kilobytes |
| DSL | 1.5 megabits per second | 185.5 kilobytes |
| Mobile 3G - Fast | 1.6 megabits per second | 200 kilobytes |
| Mobile 3G - Slow | 780 kilobits per second | 97.5 kilobytes |
WebPageTest download speeds converted from kilobits into kilobytes
While we could use these numbers they're highly oversimplified and we haven't yet accounted for network latency, Patrick Meenan explains, "If the connection to the server is warmed up (lots of previous requests) and NOTHING else is being requested at the same time then it would take 1.15 seconds (the 150 ms RTT to make the actual request + 1 second of download. TCP connections don't start at full speed though, they slowly ramp up so in practice it will tend to take a good bit longer (look into TCP Slow Start if you want more details). There is also a bit of overhead (~5 –10%) in the networking layers so best case is probably closer to 1.25 seconds."
| Connection | Download speed | RTT | Overhead | Kilobytes per second |
|---|---|---|---|---|
| Cable | 5 megabits per second | 28ms | 10% | 545 kilobytes |
| DSL | 1.5 megabits per second | 50ms | 10% | 157.675 kilobytes |
| Mobile 3G - Fast | 1.6 megabits per second | 150ms | 10% | 150 kilobytes |
| Mobile 3G - Slow | 780 kilobits per second | 200ms | 10% | 68.25 kilobytes |
One round trip and 10% network overhead factored in
Here are the same numbers with some rough latency adjustments, although they're still based on ideal conditions assuming one image and round trip. In reality you might experience multiple round trips due to Slow Start, as there are caps on packet sizes for new connections which PageSpeed estimates at ~14 KB in the first round trip.
Tests with multiple images
Most HTML emails are comprised of many small images, resulting in a longer overall page load time due to the additional latency associated with each request. In the tests I ran below with 10 image requests the Time to First Byte (TTFB) seen in green, frequently took up more time than the actual image download. As Iya Grigorik states, "When it comes to your web browsing experience, it turns out that latency, not bandwidth, is likely the constraining factor today". As latency is governed by the speed of light, besides making fewer requests your best bet is to host your images on a content delivery network (CDN) thereby optimizing the physical distance between browser and server.
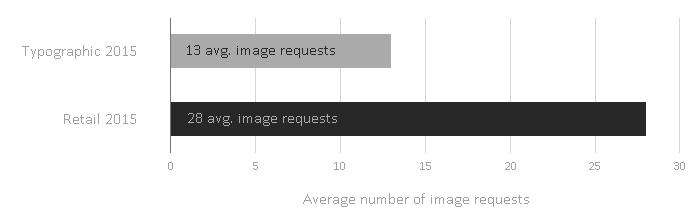 |
28 requests over 3G slow - assuming 4 concurrent connections = 1.4 seconds of latency alone
I ran a series of email tests through WebPageTest featuring both one and ten image requests, each test had 5 runs from which WebPageTest picks the median. I wanted to to see how many kilobytes I can roughly expect to download within 1 second under Cable and 3G connection speeds. There's a lot more data in the spreadsheet where I tested up to ~1 MB in image sizes. Unsurprisingly 500 KB is pushing our luck, not just under 3G but Cable also once you factor in multiple requests.
| Total image weight (KB) | 1st img. request start–doc. complete | Speed Index | Number of images |
|---|---|---|---|
| 98 kilobytes | 505 milliseconds | 901 | 10 |
| 186 kilobytes | 608 milliseconds | 995 | 10 |
| 290 kilobytes | 2270 milliseconds | 1018 | 10 |
| 432 kilobytes | 2760 milliseconds | 1070 | 10 |
Cable 5 Mbps download, same email at various resolutions e.g 1 ×, 1.5 ×, 2 ×
Loosely we can say that we exceed our 1 second image budget between 200 –300 KB under a Cable connection. It's also around this point that the Speed Index — the average time at which visible parts of the page are displayed or the perceived performance of a page — exceeds the recommended 1000 or less barrier.
| Total image weight (KB) | 1st img. request start – doc. complete | Speed Index | Number of images |
|---|---|---|---|
| 98 kilobytes | 2223 milliseconds | 1313 | 10 |
| 186 kilobytes | 3491 milliseconds | 1533 | 10 |
| 290 kilobytes | 3249 milliseconds | 2258 | 10 |
| 432 kilobytes | 4694 milliseconds | 2018 | 10 |
Mobile 3G – Fast 1.6 Mbps download, identical test emails to above
Under Mobile 3G Fast, ~100 KB of images takes around 2 seconds to download, and we've already blown our Speed Index at 1313. If you want to hit this hard, then you'll need to start thinking in sub 100 KB image downloads and fewer overall requests. Ideally 100 KB all in with your HTML and images, then you know you'll not bump up against Gmail' limits.
Gmail has a 102 KB code limit after which it clips your email, this doesn't include the weight of your images which are external, but 100 KB is a clean benchmark all in. While I'm calling this an 'image budget', external resources such as webfonts also factor in.
Speed Index
Both the Speed Index (average time at which visible parts of the page are displayed) and Start Render Time (first point in time that something was displayed to the screen), are indicators of how fast the page feels to the user. I've recorded both in the spreadsheet from my tests. Time to Interactivity is another benchmark I've come across. One reason for practicing defensive email design — live text, coded buttons etc.—is that it's actionable even with images blocked.
Metrics that measure the perceived speed rather than the actual speed can be more meaningful, as they attempt to take into account the overall user experience. While Speed Index isn't an email specific metric, we can still view it as a red flag if we exceed Paul Irish' recommendation to keep it below 1000. I like to look at the timing and Speed Index, if both are in the right ballpark then I feel I'm in decent shape.
Go in low
I think we're not alone in that although we have a device lab, much of our testing is carried out under favorable office conditions. We need to take slower connection speeds into consideration more when working out our image budgets, as the Google PageSpeed team reminds us, "3G is the dominant network type around the world, and will be for years to come, you have to optimize pages with 3G users in mind." This is echoed by Trent Walton, "Thinking of (and testing with) slow connection speeds is the best place to start" and Etsy below who monitor both Cable and 3G connection speeds.
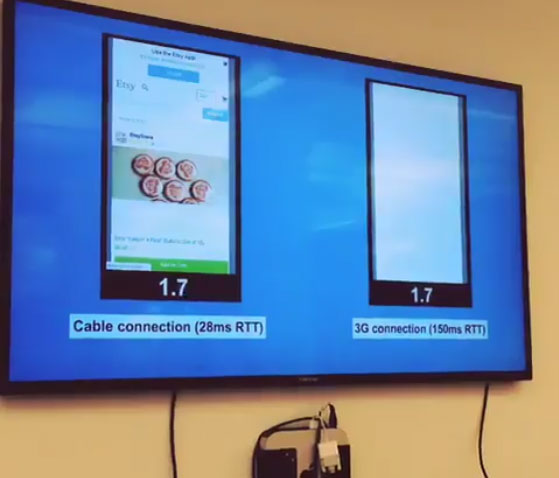 |
Etsy performance monitors showing both Cable and 3G connections which allow them to *feel* the difference
Another reason to go in low is Guy Podjarny's point that network conditions are so changeable it makes speed hard to predict so your safest bet is to, "design for a usable experience in a slow network". Latency and bandwidth estimations can seem futile when you consider all the real-world variables, especially on mobile networks. Looking at data showing how 3G download speeds can range from 0.59 – 3.84 Mbps depending on your carrier, and how it varies from state to country makes you not even want to try. But it is useful to have performance numbers to benchmark against. If we aren't hitting the numbers within the controlled conditions of a tool like WebPageTest, then we'll likely struggle even more with real-world users.